
You finally instrumented your application whether you used auto-instrumentation, hand-written spans, or some mix of the two and now you want RED metrics (Rate, Errors, Duration) for every service. Metrics is what most dashboards and alerts are built on. Its the first thing that tells you something is wrong.
You might ask yourself. Do I even need to generate these myself? Doesn't my backend do this automatically? The answer is most likely yes it does. But this where teams miss a very important detail. How are my metrics accurate if you are doing any sort of sampling?
Doesn't my backend already do this?
Frequently, yes. Several backends derive metrics from traces during ingestion, with no extra work from you.
Essentially every commercial APM has some sort of metrics generator built in: Datadog, Dynatrace, New Relic, Honeycomb, and the rest all compute request/error/latency and service-level aggregates from the spans they receive, with no extra work from you. It's the backend-side equivalent of the spanmetrics connector.
So why run the connector yourself? Two reasons.
Control. Backend generation is convenient and easy, but it runs on the backend's terms: cardinality limits, custom dimensions, and exemplar handling follow its config, not yours. The connector gives you that control
Sampling If you sample traces before they reach the backend, backend-generated metrics only count the spans that survived sampling. Your "request rate" quietly becomes "request rate among the 5% of traces we kept," which is wrong in a way nobody notices until an incident. A spanmetrics connector placed ahead of the sampler sees every span and computes metrics on the full stream, before sampling drops anything.
That second point is the whole case for generating metrics yourself. You will get accurate representation of the health of your services even if you are not sending all your traces.
How a connector is different
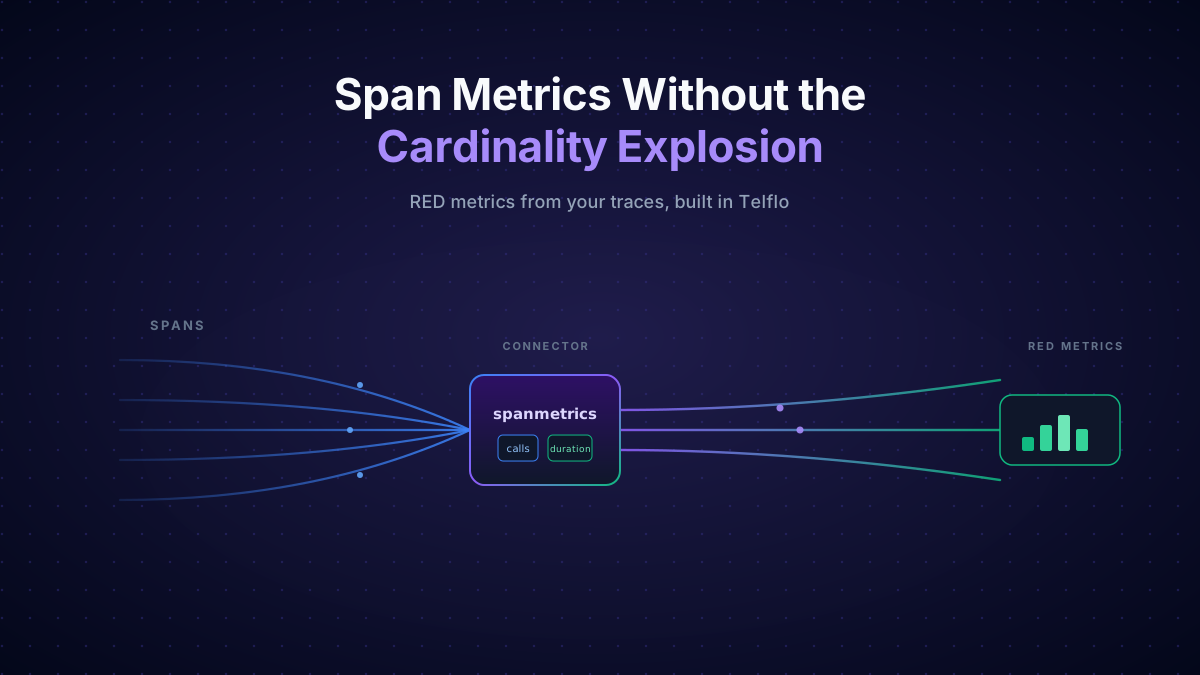
A receiver brings data in. An exporter sends data out. A connector is both at once: it's the exporter at the end of one pipeline and the receiver at the start of another. The spanmetrics connector consumes spans and produces metrics, so it lives at the end of a traces pipeline and the start of a metrics pipeline.
What it produces
With nothing but the connector added, you get two metrics, namespaced under traces.span.metrics by default:
traces.span.metrics.callsis a counter metric of how many spans matched each dimension set. That's your Rate, and once you filter by status, your Errors.traces.span.metrics.durationis a histogram of span durations. That's your Duration, the source of every p50/p95/p99 latency panel.
Both come with four default dimensions straight off each span:
service.namespan.name(the operation)span.kind(server, client, internal, producer, consumer)status.code(unset, ok, error)
A working config
Here's the minimum that does something useful. The connector takes an empty config block, since the defaults are sensible. The real work is in the pipeline wiring:
receivers:
  otlp:
    protocols:
      grpc:
        endpoint: 0.0.0.0:4317
      http:
        endpoint: 0.0.0.0:4318

connectors:
  spanmetrics:
    histogram:
      explicit:
        buckets: [2ms, 4ms, 6ms, 8ms, 10ms, 50ms, 100ms, 200ms, 400ms, 800ms, 1s, 1400ms, 2s, 5s, 10s, 15s]
    metrics_flush_interval: 15s

exporters:
  otlp/traces:
    endpoint: tracing-backend:4317
  otlphttp/metrics:
    endpoint: https://metrics-backend/v1/metrics

service:
  pipelines:
    traces:
      receivers: [otlp]
      exporters: [otlp/traces, spanmetrics]
    metrics:
      receivers: [spanmetrics]
exporters: [otlphttp/metrics]Two things to notice. First, the traces pipeline lists two exporters, your tracing backend and the connector, so the connector doesn't consume the spans, it just watches them on the way out. Second, spanmetrics shows up as a receiver in the metrics pipeline. That is what makes it a connector rather than a processor since it connects between two pipelines
The histogram buckets above are the connector's defaults, shown explicitly because they're worth tuning to your latency profile. The default unit is milliseconds; switch to seconds with histogram.unit: s if your backend expects it.
Want metric-to-trace (Examplars)? Set exemplars.enabled: true. Each metric data point then carries a few example trace IDs (exemplars.max_per_data_point defaults to 5), so a spike on a latency panel links straight to an exemplar trace. It's off by default because exemplars add storage; turn it on if your backend supports the exemplars
Adding dimensions
The four defaults answer "which operation, on which service, succeeded or failed, how fast." Real questions need more: which HTTP method, which status code, which route, which tenant. You add dimensions by naming the span or resource attributes you want promoted to labels:
connectors:
  spanmetrics:
    dimensions:
      - name: http.request.method
        default: GET
      - name: http.response.status_code
      - name: url.scheme
default: httpsEach entry pulls an attribute off the span. default supplies a value when the attribute is missing. You can target individual metrics too: histogram.dimensions adds labels only to the duration histogram, calls_dimensions only to the calls counter. And you can drop a default you don't want with exclude_dimensions: [status.code].
Becareful though. This is what makes the connector powerful.But It's also what blows up your bill.
The enemy of metrics: cardinality
Now you have metrics. You also have a new way to hurt yourself. The enemy of metrics is cardinality: the number of distinct time series. Most backends bill per series, so cardinality is the dial wired straight to your invoice, and the connector makes it very easy to turn.
Here's the scenario that gets teams. Someone ships a new checkout service whose instrumentation names spans after the request path, cart ID and all: POST /cart/8f2c9a/checkout, POST /cart/1b7e0d/checkout, one name per cart. Overnight the connector starts emitting a fresh calls and duration series for every cart anyone has ever checked out with. By morning that single service has added millions of series and the metrics bill for the whole org has doubled.
Why does it blow up so fast? Every unique combination of dimension values is a separate time series. Your metrics backend stores, indexes, and bills for each one. So the series count for the calls metric is, roughly, a product:
services × operations × span.kinds × status.codes × (every dimension you added)
Multiplication, not addition. A tidy setup (40 services, 30 operations each, 3 span kinds, 3 status codes) is already 40 × 30 × 3 × 3 ≈ 10,800 series before you add anything. Add http.response.status_code at, say, 12 distinct values and you're at ~130,000. Still fine.
The explosion doesn't come from adding more dimensions. It comes from adding one dimension with unbounded values. And the most common examples isn't a dimension you added at all. It's span.name itself.
The OpenTelemetry semantic conventions require span names to be low cardinality: GET /product/{id}, not GET /product/1YMWWN1N4O. But plenty of instrumentation gets this wrong and bakes the raw path into the name. When that happens, every product ID, every session token, every ?_ga=GA1.2.569539246.1760114706 query string becomes its own value of span.name, and therefore its own row in every metric the connector produces. The spanmetrics documentation puts it plainly:
High cardinality issues in span metrics commonly manifest in APM dashboards as an excessive number of service operations with non-unique names. Examples include URIs with unique identifiers (e.g.,
GET /product/1YMWWN1N4O) or HTTP parameters with random values.
Your operation list fills up with thousands of one-hit-wonder entries, your dashboards turn to mush, and your metrics bill starts tracking the number of unique URLs your users happen to hit. Here's how to stop it, roughly in the order you should reach for each.
Fix it at the source: the instrumentation code
The real source isn't the pipeline. It's the OpenTelemetry instrumentation in your application, the code that creates the span and decides what to call it. The semantic conventions ask that instrumentation to name the span after the low-cardinality route template, GET /product/{id}, derived from the http.route attribute, not after the concrete path the request happened to hit.
However, updatating instrumentation libraries can be time-consuming, often requiring an immediate interim solution to restore observability backend functionality. You may not own the service, the library may not expose the right configuration options, and rolling a fix across every deployment is a release cycle you don't have when the bill is already climbing.
That's where the pipeline comes in. We can sanitize the span names inside our own traces pipeline, in the Collector, without touching a line of application code. The Transform processor ships an OTTL function built for exactly this, set_semconv_span_name, which rewrites each span's name to the low-cardinality form the spec prescribes (GET /product/{id}) using the span's semconv attributes, before the connector ever sees it:
processors:
  transform/sanitize_spans:
    error_mode: ignore
    trace_statements:
      - context: span
        statements:
          - set_semconv_span_name("1.37.0")   # arg = semconv version to target

connectors:
  spanmetrics: {}

service:
  pipelines:
    traces:
      receivers: [otlp]
      processors: [transform/sanitize_spans]   # sanitize BEFORE the connector taps the stream
      exporters: [otlp/traces, spanmetrics]
    metrics:
      receivers: [spanmetrics]
exporters: [otlphttp/metrics]The placement is the whole point. The transform runs in the traces pipeline, ahead of the connector in the exporter fan-out, so the connector counts the sanitized name. error_mode: ignore keeps a span that's missing the expected attributes from failing the batch; it just keeps its original name and moves on.
Normalizing the name, whether at the source or here in the pipeline, is the only lever that fixes what the data means, not just how much of it there is. A normalized operation list is one you can actually read.
Set the cardinality limits in the connector
Sometimes you can't fix the instrumentation today: third-party libraries, a service you don't own. For that, the connector gives you a hard ceiling. aggregation_cardinality_limit caps the number of unique dimension combinations it will track:
connectors:
  spanmetrics:
aggregation_cardinality_limit: 10000Once the limit is hit, new combinations don't get their own series. They're all folded into a single overflow entry tagged otel.metric.overflow="true". Your series count stops growing and your bill stops climbing. (This needs Collector 0.130.0 or later.)
The limit is a temp fix, not a permanant fix. Overflowed data lands in one undifferentiated bucket, so you protect cost and Collector memory but lose the detail for everything past the cap. And you've still got meaningless operation names underneath. Treat aggregation_cardinality_limit as a safety net while you ship the real fix above, not as a substitute for it.
Prune what you collect
Two more options to limit cardinality directly:
exclude_dimensionsdrops default dimensions you don't need. If you never slice byspan.kind, removing it divides your series count by however many kinds you emit.resource_metrics_key_attributespins which resource attributes define a metric's identity. Without it, a deploy that changes a volatile resource attribute can fork every series into a new one. Restrict identity to the stable attributes you actually group by:
connectors:
  spanmetrics:
    exclude_dimensions: [span.kind]
    resource_metrics_key_attributes:
      - service.name
      - service.namespace
- telemetry.sdk.languageBuild it in Telflo
Rather than copy each block out of this post, you can grab the full, ready-to-run config both traces pipelines, the sanitizing transform, the connector, and the metrics pipeline, all wired together here.
Get the span metrics template in Telflo →
Test the fix before you ship it
Normally, testing a change like this means deploying a collector, pushing traffic through it, and reviewing your backen every single time you want to try a tweak. That's slow, expensive, and error-prone.
Telflo turns your OTel config into something you can unit test: feed in a sample payload and write validation rules that validates the output. For this fix we use the cardinality rule and point it at a JSONPath, set a threshold, and the run fails when the path resolves to more distinct values than that. Set it up once: type Cardinality, JSONPath $..spans[*].name, at most 1 distinct value.
![The Telflo validation rule editor: rule type set to Cardinality, JSONPath set to $..spans[*].name, operator "At most" with a distinct-values threshold of 1.](/blog/span-metrics-without-the-cardinality-explosion/cardinality-rule.png)
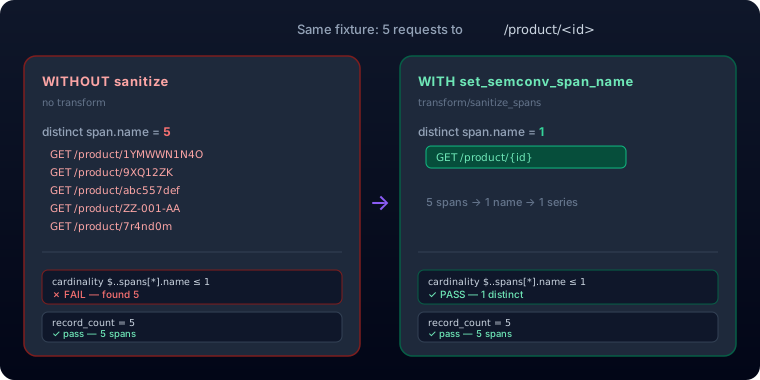
Distinct span names are the series the connector emits for that route, so the rule reads "this route collapses to a single series." Run the five-request fixture through twice: without the transform it fails (five distinct names found), with set_semconv_span_name every name normalizes to GET /product/{id} and it passes.
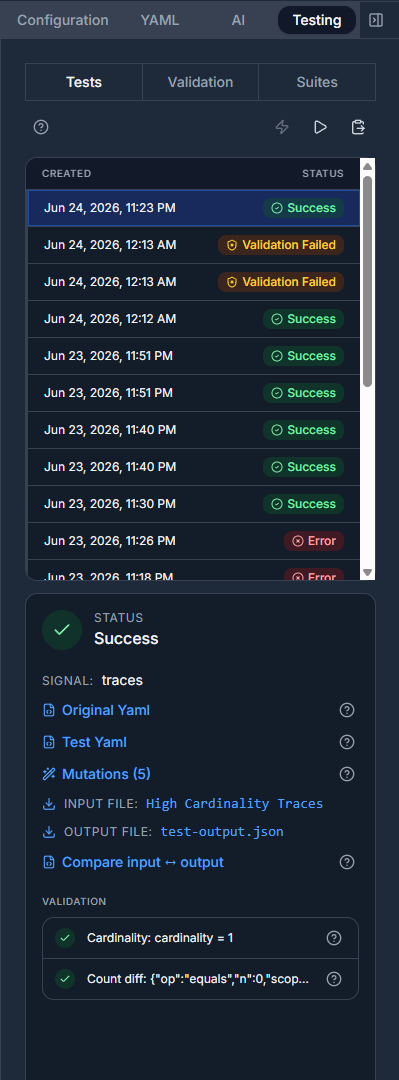
With the transform in place the run lands on Success, both rules green. Cardinality is down to one distinct value, and a count-diff rule confirms volume didn't move and it confirms that the record-count difference between input and output is zero ({"op":"equals","n":0}), so the transform may rename spans but never add or drop one.
Compare input ↔ output shows exactly what changed: the input name GET /product/1YMWWN1N4O becomes GET /product/{id} in the output. Same span, same count, just the high-cardinality tail collapsed onto the route template.
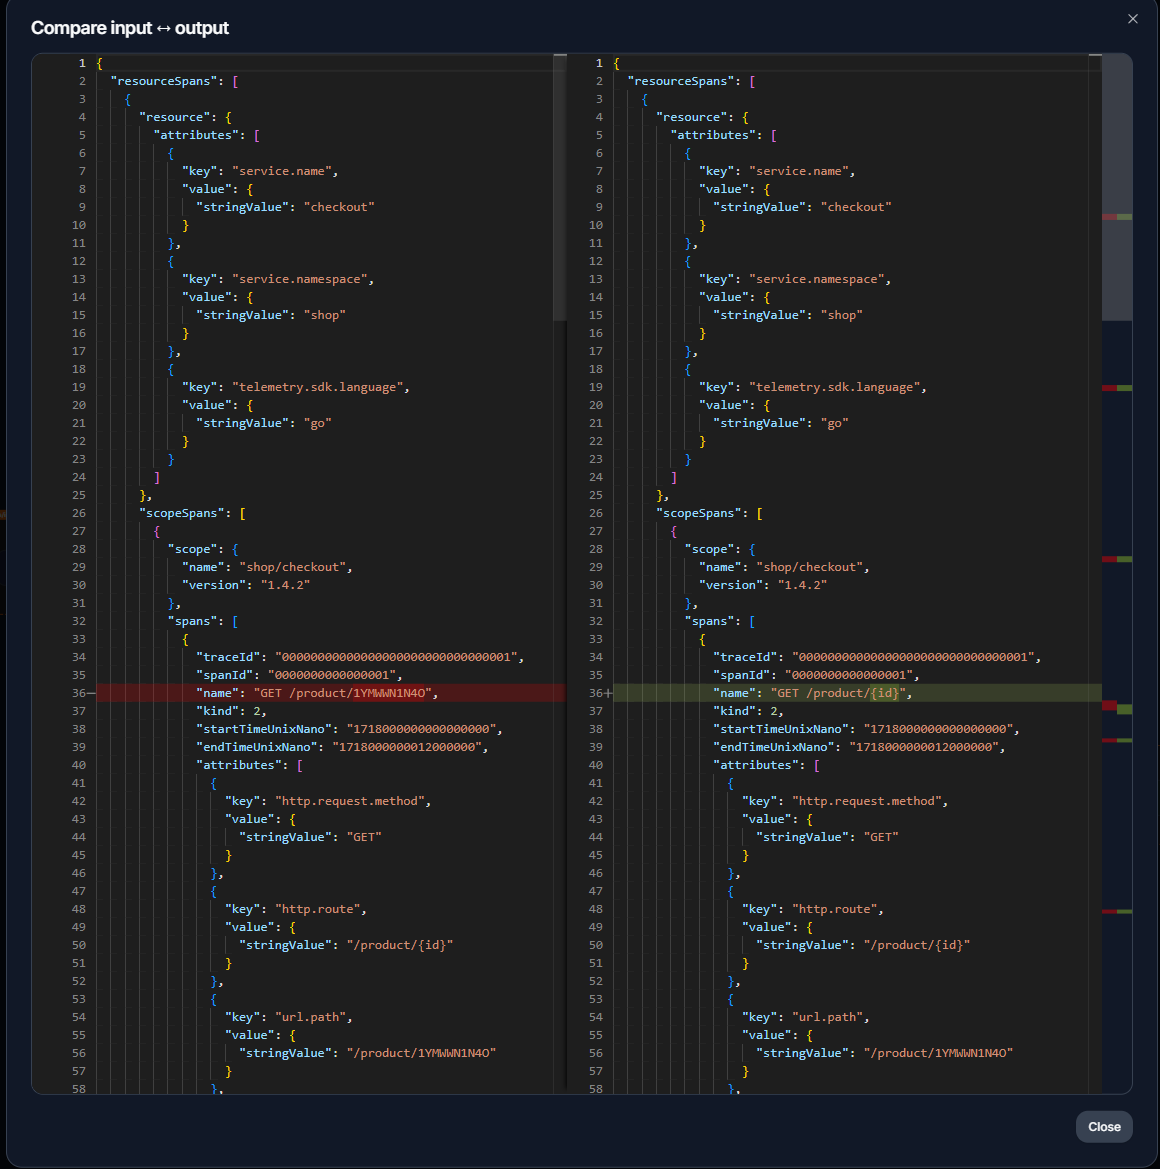
That's the whole story: the span count never moved and only the cardinality did. Wire the rules in once and any future change that reintroduces an unbounded name fails the test instead of your bill.
Get the dimensions right and the spanmetrics connector is close to free: RED metrics for every service, derived from spans you were already paying to collect. Get them wrong and it's the most expensive line on your observability bill. The difference is one transform processor, placed one step before the connector.
Manage your OpenTelemetry collectors with Telflo today.
Design, test, and deploy OpenTelemetry Collectors in one platform.
Sign up now